Operations
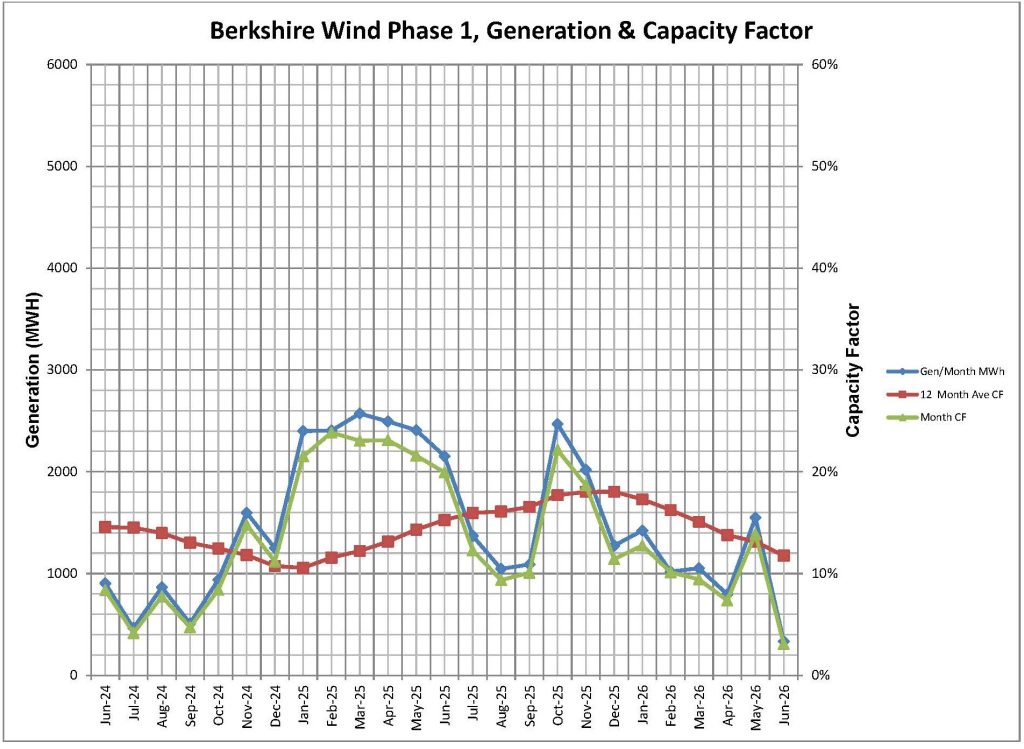
Berkshire Wind Phase I
The Unit Availability and Capacity Factors are as follows:
|
|
June 2026 |
Year-to-Date |
|---|---|---|
|
Availability Factor (AF) |
29.07% |
31.98% |
|
Capacity Factor (CF) |
3.09% |
9.47% |
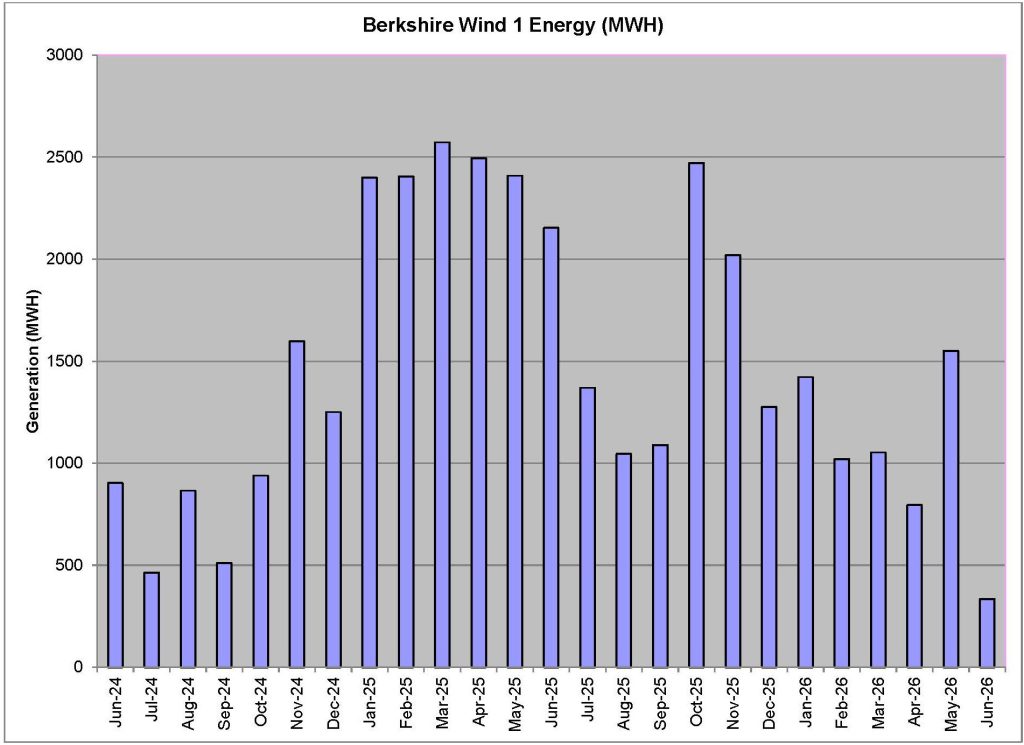
For the 2026 operating year, below is the monthly generation data and historical average monthly generation data for the project. As of June 2026, the Berkshire Wind Power Project completed 182 months of operation.
- Average Capacity Factor for the month of June since COD: 21.46%
- Capacity Factor since COD: 21.77%
Throughout the month of June, total production from Berkshire Wind Phase 1 was 333 MWh. This is significantly lower than the historical average of 1,515.05 MWh. This decrease in production was due to lower project availability.
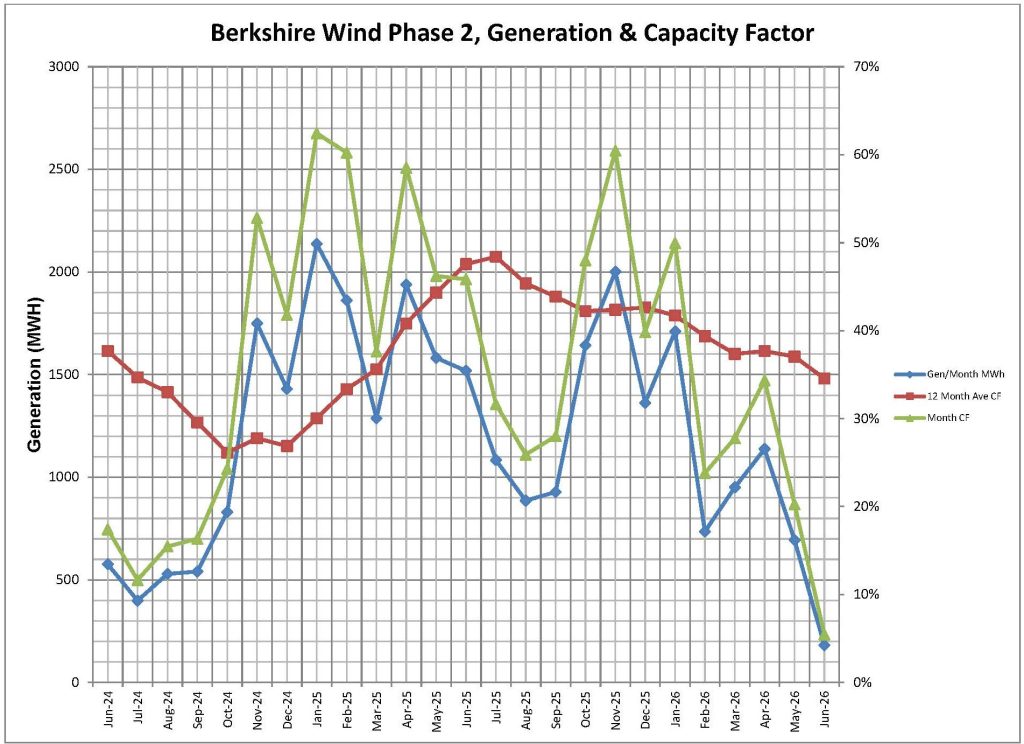
Berkshire Wind Phase II
The Unit Availability and Capacity Factors are as follows:
| June 2026 | Year-to-Date | |
| Availability Factor (AF) | 30.57% | 60.15% |
| Capacity Factor (CF) | 5.47% | 27.07% |
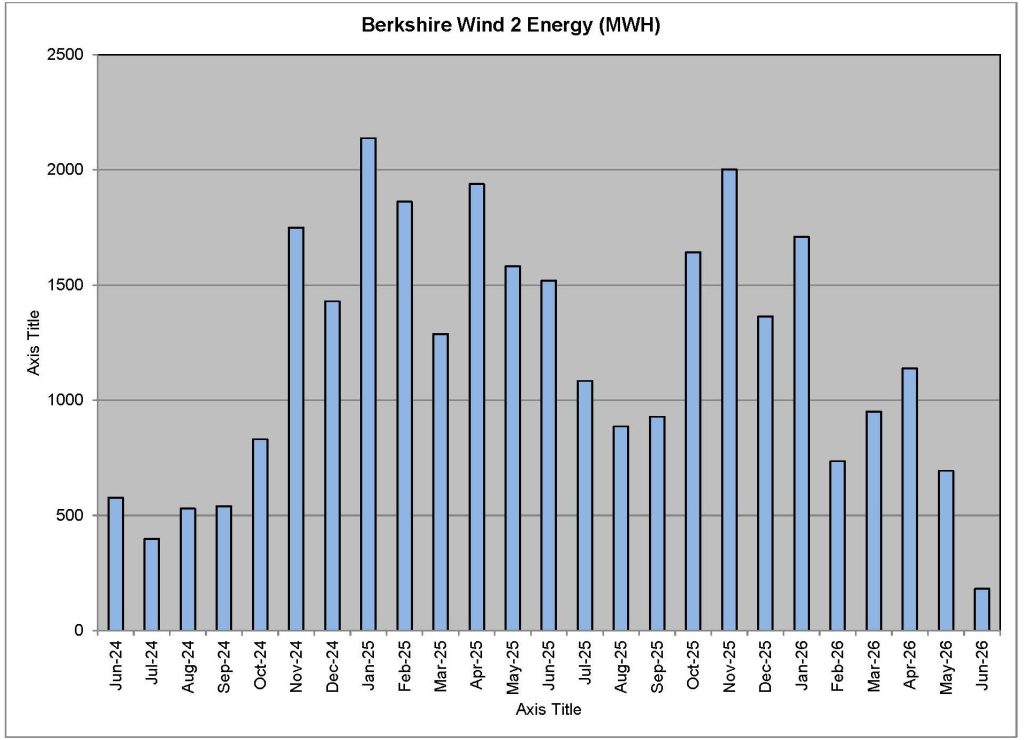
For 2026 operating year, below is the monthly generation data for the project. As of June 2026, the Berkshire Wind Phase 2 project completed 81 months of operation.
- Average Capacity Factor for the Month of June since COD: 22.01%
- Capacity Factor since COD: 31.64%
Throughout the month of June, total production from Berkshire Wind Phase 2 was 181.2 MWh. This is slightly lower than our historic average of 706.5 MWh. This decrease in generation was due to lower project availability.